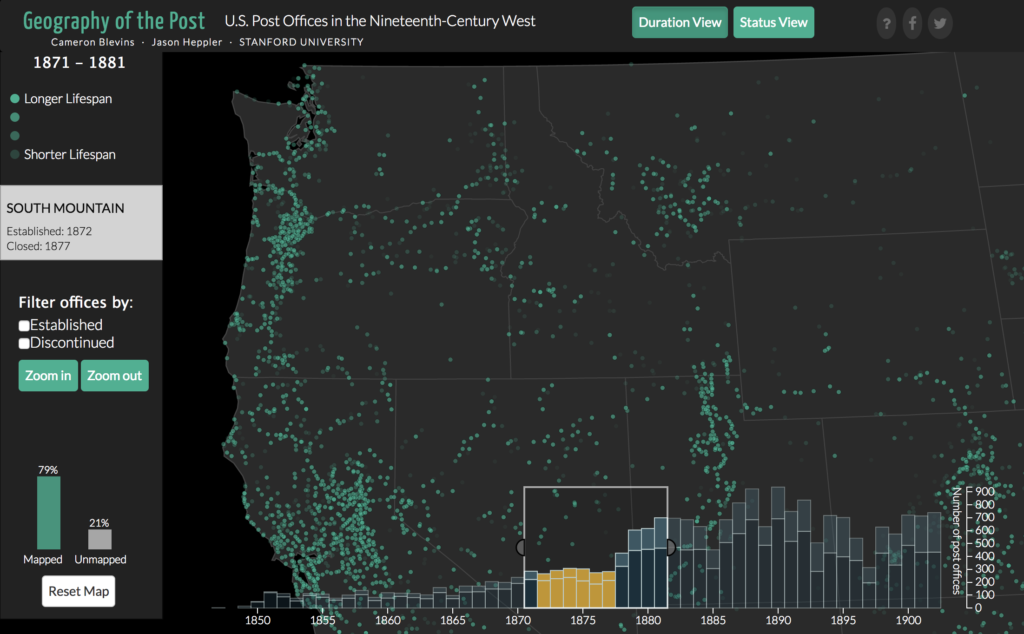
How does data visualization shed new light on the past? How does it obscure, flatten, or muddle our understanding of history? And what are the next frontiers for history and data visualization? In this talk, I will explain how visualization fits within established historical practices of archival research and analysis, evidence and interpretation, and story-telling and narrative. In my own research project, Gossamer Network: The U.S. Post and State Power in the American West, I use maps, charts, and other types of visualizations to build major new arguments about the history of the American state and its role in western expansion. My talk will offer a “behind the scenes” look at the project and its visualizations in order to engage in a frank appraisal of what worked, what didn’t, and what remains to be done. This will help concretize a larger discussion about the role of data visualization within historical inquiry and the digital humanities more broadly.
Cameron Blevins is an Assistant Professor of History at Northeastern University and is affiliated with the NULab for Maps, Texts, and Networks. He studies the nineteenth-century United States, the American West, and digital history. Cameron received his Ph.D. from Stanford University, where he worked at the Spatial History Project and the Center for Spatial and Textual Analysis (CESTA). Before coming to Northeastern he was a postdoctoral fellow at Rutgers University’s Center for Historical Analysis and a Visiting Scholar at the Rachel Carson for Environment and Society in Munich, Germany. His current research project, Gossamer Network: The U.S. Post and State Power in the American West, is a history of the nineteenth-century American state and its role in western expansion. Some of his broader interests include geography, gender history, and information visualization.

