
Felice Frankel – More Than Pretty Pictures

Graphics, images and figures — visual representations of scientific data and concepts — are critical components of science and engineering research. They communicate in ways that words cannot. They can clarify or strengthen an argument and spur interest into the research process. But it is important to remember that a visual representation of a scientific […]
Urban Tensions: Boston – Visualizing stories of cities and conflict
From gentrification and increased evictions to trucks in the bike lane, Boston, like many cities, is filled with stories of urban tensions. But are there data to illustrate these conflicts? Can you find, merge and visualize data and other layers of information that can help reveal new, original insights about the city’s urban tensions? On […]
Matthew Brehmer – Timelines Revisited: Considerations for Expressive Storytelling
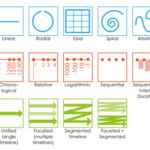
Timelines have been used for centuries to visually communicate stories about sequences of events, from historical and biographical data to project plans and medical records. Depending on how a timeline is drawn, different types of insights and temporal characteristics can be emphasized, such as those relating to event order, periodicity, or synchronicity. In recent years, […]
Cameron Blevins – The Good, the Bad, and the Unknown: Visualization and History
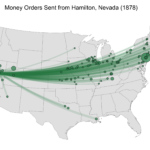
How does data visualization shed new light on the past? How does it obscure, flatten, or muddle our understanding of history? And what are the next frontiers for history and data visualization? In this talk, I will explain how visualization fits within established historical practices of archival research and analysis, evidence and interpretation, and story-telling […]
Mahir Yavuz: Topos – Understanding cities with AI
Abstract Mahir will talk about the work and the vision of Topos. How to further advance the understanding of cities and neighborhoods in light of the technological sea-change underway in the realms of Big Data and Artificial Intelligence. Pulling from a wide variety of technologies and disciplines — computer vision, natural language processing, network science, machine learning, […]