NUVis Roundtable: Tapestry 2017 post-conference briefing and discussion
Want to know what exciting new research and stories were presented at the Tapestry conference? Or did you attend and have news or opinions to share? We invite you to join us for a roundtable discussion where conference attendees will share their favorite talks and demos as well as summarize the hot-topic discussions at the […]
Felice Frankel – More Than Pretty Pictures
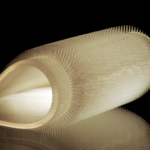
Graphics, images and figures — visual representations of scientific data and concepts — are critical components of science and engineering research. They communicate in ways that words cannot. They can clarify or strengthen an argument and spur interest into the research process. But it is important to remember that a visual representation of a scientific […]
Matthew Brehmer – Timelines Revisited: Considerations for Expressive Storytelling
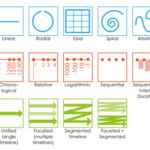
Timelines have been used for centuries to visually communicate stories about sequences of events, from historical and biographical data to project plans and medical records. Depending on how a timeline is drawn, different types of insights and temporal characteristics can be emphasized, such as those relating to event order, periodicity, or synchronicity. In recent years, […]
Mahir Yavuz: Topos – Understanding cities with AI
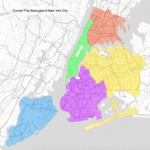
Abstract Mahir will talk about the work and the vision of Topos. How to further advance the understanding of cities and neighborhoods in light of the technological sea-change underway in the realms of Big Data and Artificial Intelligence. Pulling from a wide variety of technologies and disciplines — computer vision, natural language processing, network science, machine learning, […]
Colin Ware – Visual Queries and Design
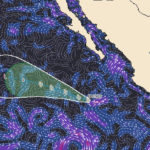
The visual query is a basic component of all analytic seeing and understanding visual queries is an essential part of the design of information visualizations. Simply put, a visual query is a process whereby a problem is addressed through a pattern search. It is an analytic visual act of seeing. For example, the visual queries […]

